
Contents
Key Takeaways
- Overtrading is defined by process violation, not transaction frequency: Executing numerous trades is legitimate for systematic high-frequency or scalping strategies; overtrading occurs when positions exceed strategic edge, risk parameters, or cognitive capacity.
- Operant conditioning and variable reward schedules: Financial markets function similarly to intermittent reinforcement systems (Skinnerian conditioning), where dopamine anticipation prior to trade initiation reinforces compulsive execution habits.
- The hidden friction drag: Cumulative bid-ask spreads, execution commissions, financing fees, and slippage steadily erode positive mathematical expectancy as trade frequency escalates.
- De-cannibalized cluster integration: Overtrading differs from acute revenge trading and impulsive FOMO chasing; it represents a chronic behavioral pattern requiring structural operational guardrails.
- Actionable anti-overtrading architecture: Implementing strict daily execution caps, mandatory post-trade latency timers, and binary setup grading (A-tier only) effectively interrupts compulsive trading loops.
- Measuring process over outcome: Sustainable behavioral recovery relies on tracking objective metrics such as the Rule Adherence Rate (RAR) and Impulsive Execution Percentage rather than short-term P&L fluctuations.
Many aspiring market participants operate under the intuitive yet flawed assumption that increased market activity correlates directly with greater professional productivity. They spend consecutive hours monitoring tick charts, scanning dozens of instruments, and executing orders whenever price exhibits minor momentum. Yet, despite continuous effort, their equity curves frequently experience severe stagnation or steady capital decay.
In quantitative trading and behavioral finance, this destructive behavioral pattern is known as overtrading. Overtrading occurs when a market participant initiates and manages more positions than their trading edge, capital preservation parameters, or analytical bandwidth can reasonably justify. It manifests in taking low-probability setups, trading out of boredom during illiquid consolidations, multiplying positions to recover losses, and experiencing acute psychological discomfort when holding 100% cash.
Breaking this self-reinforcing pattern requires far more than simplistic admonitions to “be more disciplined.” Traders must deconstruct the neurochemical and psychological triggers that drive compulsive market entry, quantify the severe financial friction of transaction drag, and establish a rigid operational framework that rewards selectivity over market exposure. As established in our guide to trading psychology and emotional discipline, long-term market longevity is determined by process execution rather than constant market participation.

1. What Is Overtrading? Process vs. Frequency
A fundamental misconception in retail trading is that overtrading can be defined by an arbitrary, universal number of daily transactions. In professional market operations, trade frequency is dictated entirely by strategy mechanics, execution latency, and holding periods.
For example, an institutional market maker or retail scalper exploiting order-flow imbalances may legitimately execute 25 to 50 micro-positions during the London open, with each entry strictly satisfying mathematical edge and automated risk parameters. Conversely, a multi-day swing trader who opens three unverified trades in a single afternoon because they grew restless waiting for a weekly setup has engaged in severe overtrading.
The defining criterion of overtrading is the relationship between the transaction and the trader’s predefined system. If an entry is executed without satisfying verified criteria, it constitutes overtrading—regardless of whether it represents the trader’s second trade of the month or their twentieth trade of the morning.
| Operational Dimension | Systematic Planned Trading | Compulsive Overtrading |
|---|---|---|
| Entry Catalyst | Strict adherence to predefined, verified setup criteria. | Subjective impulse, boredom, market motion, or emotional discomfort. |
| Execution Frequency | Naturally dictated by market regime and strategy conditions. | Artificially inflated by the trader’s urge to remain continuously active. |
| Risk Calculation | Fixed-fractional dollar risk calibrated prior to order placement. | Arbitrary lot sizing; emotional adjustments during live candle formation. |
| Inactivity Tolerance | Holding cash and waiting is recognized as an active strategic position. | Being flat generates intense anxiety, FOMO, or feelings of unproductivity. |
| Analytical Justification | Every position possesses a documented, falsifiable technical thesis. | Entries have vague, post-hoc justifications (“it looked like a breakout”). |
| Evaluation Standard | Assessed across statistical sample sizes (e.g., 50–100 trades). | Dominated by recent isolated outcomes, triggering rapid behavioral shifts. |
2. Why Traders Keep Entering Unnecessary Trades
Treating overtrading merely as a “lack of willpower” ignores the powerful neurobiological reinforcement loops that modern electronic financial markets trigger. To systematically eliminate the compulsion to trade, one must understand the cognitive mechanisms that sustain it.
2.1 Operant Conditioning and the Variable Reward Schedule
The primary psychological engine of overtrading is identical to the mechanism underlying slot machine addiction: intermittent, variable-ratio reinforcement (Skinner, 1953). In financial markets, any random click of the “Buy” or “Sell” button has an immediate, non-zero probability of generating a positive financial return, even if the trade had zero technical validity.
Because the reward is unpredictable, the human brain releases massive surges of dopamine not upon receiving the profit, but during the anticipation of the reward—specifically at the moment of order placement. Over time, the physical act of entering a trade becomes an autonomous source of neurochemical stimulation. The trader becomes addicted to the sensation of being exposed to risk, rendering market inactivity emotionally unbearable.
2.2 The “Action Bias” and the Illusion of Productivity
In traditional professions, there is a direct linear relationship between physical or mental activity and economic output: working more hours generally yields more work completed. In financial trading, this relationship is non-linear and frequently inverted.
Behavioral economists have identified the Action Bias (Bar-Eli et al., 2007)—the natural human tendency to favor action over inaction when faced with uncertainty, even when evidence demonstrates that inaction yields superior results. Traders afflicted with this bias equate sitting on hands with laziness or failure. They enter marginal positions simply to satisfy the subconscious psychological need to feel “at work.” Experimental economics confirms that individual market participants frequently trade at frequencies that diminish expected net wealth, even when transaction costs are explicitly known in advance (Fellner-Röhling & Krügel, 2018).
2.3 Differentiating Overtrading from FOMO and Revenge Trading
While overtrading frequently intersects with other emotional breakdowns in the trading psychology cluster, maintaining conceptual clarity is critical for diagnosis and treatment:
- Overtrading vs. FOMO: While FOMO in trading describes the acute, outward-focused impulse to chase an extended parabolic move before it leaves without you, overtrading is a chronic internal urge to generate continuous market engagement. FOMO often triggers specific overtraded entries, but overtrading persists even in stagnant, dead-range markets.
- Overtrading vs. Revenge Trading: As detailed in our guide on how to stop revenge trading and chasing losses, revenge trading is an acute, emotionally hostile retaliation triggered specifically by a recent painful loss. Overtrading, however, is equally prevalent following winning streaks, where euphoria degrades risk standards.
- Overtrading vs. Emotional Volatility: Overtrading acts as the operational conduit through which the broader emotional cycle of trading destroys accounts, accelerating transitions from confidence to fear.
2.4 Post-Win Euphoria: The Overconfidence Trap
A dangerous misconception is that overtrading only occurs during losing periods. Empirical studies in behavioral finance (Barber & Odean, 2000, 2001) demonstrate that retail participants increase their trading volume significantly following sequences of profitable trades. Unearned profits generate cognitive overconfidence, leading traders to attribute systemic market beta to personal predictive genius. Entry criteria are relaxed, and positions are initiated indiscriminately until an inevitable market reversal wipes out accumulated gains.
3. How Overtrading Increases Trading Costs
While the psychological damage of overtrading is severe, its immediate financial consequence is the silent destruction of edge via transaction drag. Every single trade executed in modern financial markets carries embedded structural costs that widen the statistical hurdle required to achieve profitability.
The Mathematics of Friction: A Scaled Model
Consider a trader operating a $20,000 retail account who trades standard foreign exchange or index contracts. When accounting for the bid-ask spread, round-turn commissions, and realistic slippage, the average friction cost is approximately $5.00 per trade per standard contract.
- Disciplined Operator (12 planned trades/month): Monthly friction = $60 | Annual drag = $720 (3.6% of account equity).
- Moderate Overtrader (60 trades/month): Monthly friction = $300 | Annual drag = $3,600 (18.0% of account equity).
- Chronic Overtrader (200 trades/month): Monthly friction = $1,000 | Annual drag = $12,000 (60.0% of account equity).
Higher trading frequency increases cumulative transaction costs, raising the performance threshold a strategy must overcome to remain profitable. When additional trades fail to generate sufficient positive expectancy, spreads, commissions, financing charges, and slippage can gradually erode overall performance.
The figures above are illustrative estimates based on an assumed average friction cost of $5 per trade per standard contract. Actual costs vary by broker, instrument, position size, liquidity, and execution conditions.
The Degraded Signal-to-Noise Ratio (SNR)
As trading frequency escalates, traders inevitably compress their operational timeframe—shifting from daily and 4-hour charts down to the 5-minute, 1-minute, or tick charts. Lower timeframes can expose traders to more short-term price fluctuations and market noise, depending on the instrument, trading strategy, and prevailing market conditions. In ultra-low timeframes, price motion is largely dominated by institutional algorithmic liquidity rebalancing and random variance rather than directional intent. By seeking setups in high-noise environments, overtraders may mistake random price fluctuations for meaningful patterns.
4. The Cycle That Leads to Overtrading
Overtrading is rarely an isolated mistake; it operates as a repetitive behavioral loop. Recognizing where you are within this sequence allows you to pause and interrupt the cycle before losses accumulate.
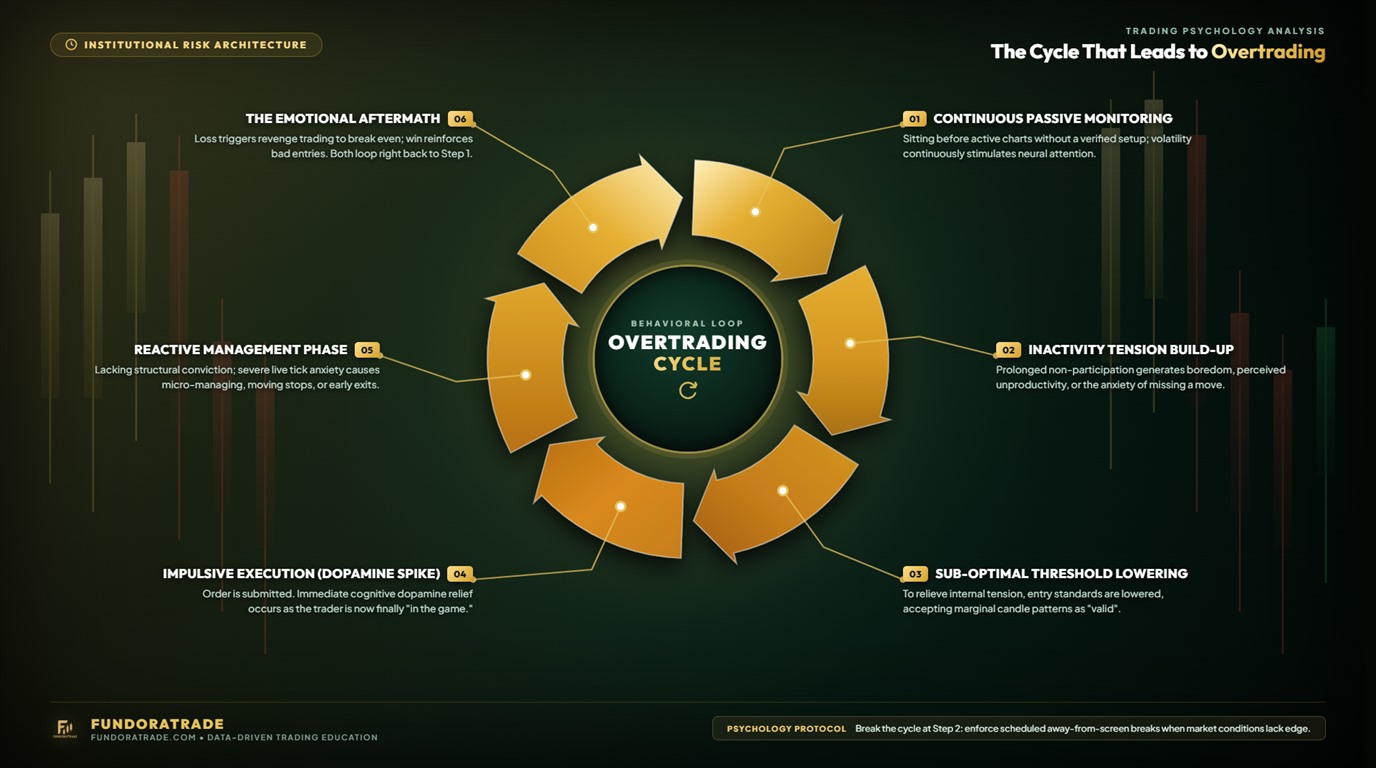
- Continuous Passive Monitoring: The trader sits before active charts without a verified setup, allowing market volatility to continuously stimulate neural attention.
- The Inactivity Tension Build-Up: Prolonged non-participation generates boredom, perceived unproductivity, or the anxiety of missing a move.
- The Sub-Optimal Threshold Lowering: To relieve internal tension, the trader lowers entry standards, convincing themselves that a marginal candle pattern represents an “acceptable” setup.
- The Impulsive Execution (Dopamine Spike): The order is submitted. Immediate cognitive relief occurs as the trader is now “in the game.”
- The Reactive Management Phase: Lacking a rigorous structural thesis, the trader experiences severe anxiety during live candle fluctuations, micro-managing the position, moving stops, or taking premature profits.
- The Emotional Aftermath: A loss triggers frustration and the urgent desire to break even; a win reinforces the false belief that low-quality entries work. Both outcomes loop back to Step 1.
5. Seven Warning Signs of Overtrading
Conduct an objective self-audit. If several of these patterns repeatedly appear in your trading sessions, they may indicate that your trading activity is becoming excessive or increasingly disconnected from your predefined strategy:
- 1. The Elevator Pitch Test Fails: You cannot articulate the exact technical invalidation level, higher-timeframe liquidity objective, and mathematical risk-to-reward ratio of an open trade in two concise sentences.
- 2. Immediate Post-Loss Re-Entry: Following a stop-out, you initiate a new position within less than five minutes on the same or a correlated instrument.
- 3. Physical Unease During Flat Periods: Holding zero open market exposure feels unproductive, stressful, or boring, prompting you to scan unrelated assets for an excuse to trade.
- 4. Session Drift: You enter trades outside your designated operational hours (e.g., executing Asian session scalps when your verified strategy is built for the New York open).
- 5. Ghost Setups in the Journal: Your weekend review reveals executions that cannot be cross-referenced with any rule in your written trading plan.
- 6. Disproportionate Platform Screen Time: You spend eight hours actively watching tick charts but less than fifteen minutes conducting systematic post-market analysis.
- 7. Escalating Lot Frequency: While your account equity remains stagnant or declining, the gross number of monthly executions steadily increases.
6. How to Stop Overtrading
Resolving overtrading requires replacing pure willpower with practical friction and protective rules. The objective is straightforward: make unplanned trades harder to execute and disciplined trades seamless to follow.
Step 1: Formalize Binary Entry Criteria
Vague rules invite emotional interpretation. Replace qualitative rules such as “buy when momentum is bullish” with an objective, binary checklist. For detailed guidance on structuring institutional-grade rules, reference our framework on how to write an actionable trading plan. Every potential setup must pass 100% of the binary criteria before the order interface is unlocked.
Step 2: Hard-Code Daily Execution Ceilings
Establish an explicit ceiling on the maximum number of executed positions permitted per day or per session. For many active day traders, capping daily volume at two or three completed trades serves as an effective starting benchmark, while swing traders might allow only one or two entries per week. Crucially, your exact ceiling should be calibrated to your trading style, setup frequency, and personal focus capacity—and this ceiling is always an upper boundary, not a daily quota to fulfill. If market conditions offer zero qualifying setups, executing zero trades represents a completely disciplined trading performance.
Step 3: Introduce a Structured Cooling-Off Period
Impulsive execution thrives on emotional urgency. A short cooling-off period after closing a trade can help interrupt impulsive re-entry and create time to reassess market conditions objectively. The duration should be adapted to the trader’s strategy and emotional state rather than treated as a universal physiological recovery period. The essential discipline is ensuring that you never re-enter the market while processing the immediate emotional aftermath of a win or a loss.
Step 4: Establish Daily Loss and Drawdown Caps
Enforce an automatic stop for the session upon reaching a predetermined maximum loss limit. While some retail traders use a 2% to 3% daily drawdown limit as an illustrative guideline, there is no universal threshold that fits every account. Your loss ceiling must be tailored to your specific trading strategy, historical drawdowns, account size, and risk tolerance—for example, prop firm accounts typically demand much tighter daily risk parameters (often 1% or less) to safeguard trailing equity buffers. The critical objective is establishing an objective, non-negotiable threshold that terminates trading before emotional distress can trigger revenge trades. To ensure position sizes remain mathematically bounded, always calculate exact lot allocations using the position size calculator prior to order placement.
Step 5: Mitigate Cognitive Depletion
Continuous chart monitoring directly causes mental exhaustion. As demonstrated in our research on decision fatigue and mental performance in trading, executive brain functions degrade rapidly after extended visual exposure. Rather than monitoring screens continuously throughout the day, structure your market observation into defined focus periods—such as 60-to-90-minute blocks aligned with major session opens—separated by intentional breaks to restore attention and patience.
7. How to Measure Your Trading Discipline
Do not evaluate your recovery from overtrading by your daily profit or loss. Short-term P&L in financial markets contains significant random variance. Instead, evaluate recovery through objective behavioral metrics.
1. Rule Adherence Rate (RAR)
Calculate the exact percentage of your trades that adhered 100% to your written plan from entry through exit:

As explored in our dedicated guide on evaluating process over outcome in trading, an unprofitable trade that maintained 100% plan compliance is an operational victory; an undisciplined trade that produced a random profit is a dangerous operational failure.
2. Impulsive Trade Percentage (ITP)
Maintain a record of impulsive trades (executions triggered by boredom, FOMO, or unverified price action) relative to total trades. While the long-term goal is eliminating impulsive decisions entirely, many traders use an initial target of keeping impulsive trades below 5% across rolling 30-trade samples, progressively tightening this boundary as their execution discipline strengthens.
3. Monthly Friction-to-Expectancy Ratio
Calculate your total paid transaction costs (spreads + commissions + swap) as a proportion of your gross trading profitability. While acceptable friction varies considerably across styles—scalpers naturally pay higher cumulative transaction fees relative to gains than swing traders—friction consuming more than 20% to 25% of gross profits serves as a clear warning that high execution frequency is eroding your net statistical edge.
8. A 14-Day Protocol to Break the Compulsive Trading Loop
Implement this progressive, two-week behavioral reset to recalibrate your relationship with market activity:
| Phase | Timeframe | Operational Mandate | Primary Behavioral Objective |
|---|---|---|---|
| Phase 1: Observation | Days 1–3 | Do not change trade frequency. Log every single trade with its underlying psychological catalyst (Boredom, Plan, FOMO, Revenge). | Establish an honest, quantified baseline of cognitive triggers without self-deception. |
| Phase 2: Execution Caps | Days 4–7 | Apply a strict daily ceiling (e.g., maximum 2 trades per session) tailored to your strategy. Once reached, close the platform. | Force selectivity; eliminate marginal B and C-tier setups. |
| Phase 3: The Latency Lockout | Days 8–11 | Implement a deliberate cooling-off pause (e.g., 20–30 minutes) after closing a position. Disable one-click trading. | Break the neurological dopamine loop linking trade closure to immediate re-entry. |
| Phase 4: Behavioral Audit | Days 12–14 | Review rolling 14-day metrics: compute Rule Adherence Rate and total friction saved. Recalibrate rules for the subsequent month. | Cement process-oriented thinking; confirm capital preservation through selective inactivity. |
9. Recognizing Pathological & Compulsive Trading Behavior
There is a distinct clinical boundary between retail overtrading caused by poor habits and compulsive trading disorder. Financial markets can trigger behavioral patterns identical to pathological gambling (Griffiths, 2004; Arthur et al., 2016).
If you find yourself borrowing capital to trade, hiding trading activity or losses from family members, trading with funds allocated for essential living expenses, or experiencing intense depression, insomnia, or anxiety when away from the charts, your overtrading is no longer a tactical strategic issue. In these situations, the only rational action is to immediately suspend all live trading accounts, remove trading applications, and seek consultation from qualified mental health professionals specializing in financial addictions.
Scientific References & Academic Literature
- Arthur, J. N., Williams, R. J., & Delfabbro, P. H. (2016). The profile of the frequent day trader: A comparison with non-traders and other gamblers. Journal of Gambling Studies, 32(3), 859–875.
- Barber, B. M., & Odean, T. (2000). Trading is hazardous to your wealth: The common stock investment performance of individual investors. The Journal of Finance, 55(2), 773–806.
- Barber, B. M., & Odean, T. (2001). Boys will be boys: Gender, overconfidence, and common stock investment. The Quarterly Journal of Economics, 116(1), 261–292.
- Bar-Eli, M., Azar, O. H., Ritov, I., Keidar-Levin, Y., & Schein, G. (2007). Action bias among elite soccer goalkeepers: The case of penalty kicks. Journal of Economic Psychology, 28(5), 606–621.
- Fellner-Röhling, G., & Krügel, S. (2018). Do investors trade too much? A laboratory experiment. Journal of Economic Behavior & Organization, 150, 48–66.
- Griffiths, M. (2004). Stock market speculation: A forms of gambling? Gambling Research: Journal of the National Association for Gambling Studies, 16(2), 52–63.
- Lo, A. W., & Repin, D. V. (2002). The psychophysiology of real-time financial risk processing. Journal of Cognitive Neuroscience, 14(3), 323–339.
- Skinner, B. F. (1953). Science and Human Behavior. Macmillan.
Frequently Asked Questions
What constitutes overtrading in financial markets?
Overtrading is the execution of transactions that exceed the mathematical boundaries of a trading plan, capital risk parameters, or executive decision capacity. It is defined by process non-compliance, such as taking unconfirmed setups or trading out of boredom, rather than raw transaction count.
How does overtrading differ from high-frequency scalping?
High-frequency scalping is a deliberate, systematic strategy designed to exploit small, short-term statistical inefficiencies with predetermined risk and automated execution. Overtrading is an undisciplined behavioral impulse that ignores strategic parameters to satisfy emotional needs for stimulation or recovery.
Why does overtrading frequently intensify after winning streaks?
Consecutive winning trades stimulate excessive dopamine release, generating an illusion of control and acute overconfidence. Traders mistakenly attribute systemic market moves to personal foresight, relaxing their entry standards and multiplying position frequency until a normal market correction causes severe drawdowns.
How does transaction drag impact overtraded accounts?
Every trade incurs embedded transaction costs, including bid-ask spreads, broker commissions, swap rates, and execution slippage. As trade volume escalates, these friction costs compound, requiring an unachievable gross mathematical edge simply to break even.
What is the most effective psychological intervention to stop overtrading?
The most effective intervention is introducing protective boundaries: disabling one-click trading, establishing a clear daily execution ceiling based on your strategy, requiring a completed checklist prior to entry, and enforcing a deliberate cooling-off pause after each closed position to prevent emotional re-entry.
Risk Warning: Trading leveraged financial instruments carries a substantial level of risk and can result in the loss of all invested capital. The information provided by FundoraTrade is educational and informational only and does not constitute financial, investment, or trading advice. Past statistical performance and hypothetical illustrations do not guarantee future market outcomes. Never trade with capital you cannot afford to lose.