
Contents
Key takeaways
- Market Profile reads price structure through time and volume, not just the four values from a candle. It shows where the market actually spent its time.
- The Point of Control (POC) is the price level with the most trading activity in a session or period. It acts as the market’s reference for balance.
- The Value Area holds roughly 70% of a period’s volume or time. Its upper and lower edges (VAH and VAL) are the boundaries traders watch for acceptance or rejection.
- Inside the Value Area, price tends to rotate. Outside it, directional moves become more likely once price is accepted at a new level.
- Market Profile is an analysis layer, not a risk system. Pair it with position sizing, stop placement and drawdown checks.
If you have traded forex or futures for a few years, you may have noticed that candles do not tell the whole story. A candle gives you four numbers: open, close, high and low. It does not tell you how many hours price sat in one band, where the heaviest trading happened, or where the market was simply resting. This market profile trading guide fills that gap. It shows you where the market spent its time, and that changes how you read a chart.
We will start from the basics: profile structure, the POC, how the Value Area is built, and how to use all three in daily decisions. The goal is not to turn you into a full-time profile specialist. The goal is to add a tool that gives you context for decisions instead of predictions.
What Is Market Profile and What Does It Show?
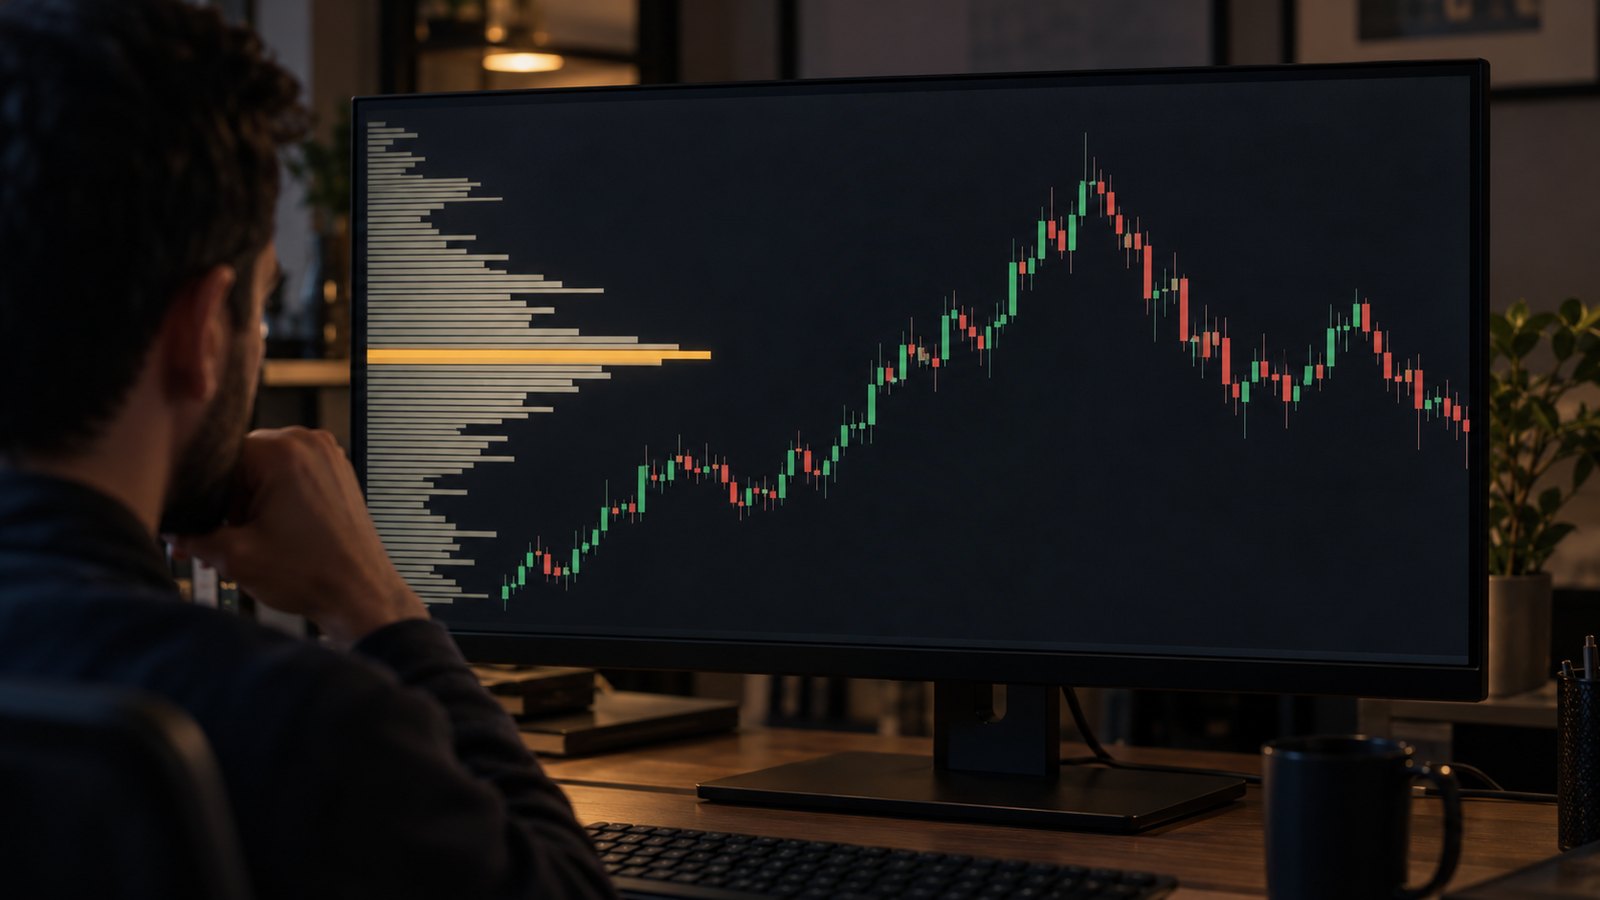
Market Profile is a graphical view of how price is distributed over time. Instead of a horizontal time axis with price drawn as a line, price sits on the vertical axis. Each price level is marked with letters or blocks that reflect how much activity occurred there. The result looks like a horizontal histogram. Its widest section is the band where the market spent the most time or traded the most volume.
How it differs from a candlestick chart
On a candlestick chart, one time period becomes one candle, and everything inside that period is lost. Market Profile breaks the same period into many price levels and shows how much activity happened at each one. A session that looks quiet on a candle chart can look very different on a profile. You may see two clear peaks, a long thin tail, or a lopsided shape that tells you one side of the market gave up.
The logic behind the tool
The core idea is that markets move between balance and imbalance. In balance, price stays in a range and buyers and sellers agree on value. In imbalance, one side steps away and price moves quickly to find a new area of agreement. The profile makes both states visible. A wide, symmetric shape suggests balance. A narrow shape with a long tail suggests imbalance and a fast move.

What Is the POC and Why Does It Matter?
The Point of Control is the price level with the most trading activity in a given period. If the profile is built on volume (Volume Profile), the POC is the level with the highest volume. If it is built on time (Time Profile, also called TPO), the POC is the level where price spent the most time. In both cases, it marks the price where the market found the most agreement.
Why traders watch the POC
The POC acts like a magnet. When price moves away from it, it often drifts back, because that level held the most liquidity and trader interest. This gives you two uses. First, it can serve as a target for rotation trades inside the range. Second, it is a reference for judging whether a move has real strength. If price leaves the POC and fails to hold the new area, the likelihood of a rotation back toward the POC increases.
Daily POC versus weekly POC
The POC of each period means something different. A daily POC suits intraday and scalping decisions. A weekly POC suits swing traders. A monthly POC suits a longer view. Plot all three and you will see they sometimes overlap and sometimes do not. When the daily and weekly POCs sit at the same price, that level is stronger. When they are far apart, the market is out of balance across timeframes.
Understanding the Value Area and Its Edges
The Value Area is the band that holds most of a period’s trading activity. In the standard definition, it covers about 70% of volume or time, though that number is a convention you can adjust for your market. Its two edges are called VAH (Value Area High) and VAL (Value Area Low).
What VAH and VAL tell you
VAH and VAL are the boundaries of balance. While price stays inside them, the market is in balance and rotation is more likely. When price breaks above VAH and holds there, the market has accepted a higher value and may build a new balance area. A break below VAL follows the same logic to the downside. The break alone is not enough. Watch whether price accepts the level as new support or resistance after the break.
Acceptance versus rejection
Two concepts do most of the work here. Acceptance means price crosses the edge, stays outside for a while, and builds a new profile in that area. Rejection means price crosses the edge but quickly returns inside, leaving no profile behind. Experienced traders give more weight to acceptance and treat rejection as a sign of a weak move. The profile shows whether a new area of agreement is forming.

How to Read Market Profile in Practice
Reading a profile is a skill, and like any skill it takes repetition. The steps below give you a routine you can run on your own charts today.
- Pick a period that matches your horizon. Use a daily profile for intraday work and a weekly profile for swing trading.
- Mark the POC and the Value Area edges (VAH and VAL) on your chart.
- Check whether current price is inside or outside the Value Area.
- If price is inside, expect rotation and look for signals near the edges.
- If price is outside, decide whether acceptance or rejection is forming. Study the new profile in the outer area.
- Compare the POC and Value Area edges with classic support and resistance and with Fibonacci levels to find overlaps.
- Size the trade from the stop distance, not from emotion. The position size calculator does this in seconds.
Combining it with other tools
Market Profile works best as part of a stack. Pair it with VWAP, classic levels and a volatility check. Futures traders can use the futures tick value calculator to measure the risk of each contract precisely. Forex traders should keep the pip value calculator open, because a stop distance in pips means nothing until you convert it to dollars.
Reading profiles on news days
On days with major economic releases, such as FOMC meetings or CPI prints, the profile often takes a different shape. The Value Area may shift and a new POC may form. On these days, check what range the prior session built and whether the news broke it. If the release pushes price outside the prior Value Area and a new profile forms there, that is acceptance. If price snaps back inside, treat the move with caution.
Initial Balance (IB) and Daily Auction Types
The Initial Balance (IB) represents the price range established during the first two 30-minute trading periods (periods A and B, or the first hour of regular trading). The width and behavior of the Initial Balance provide essential clues about whether the upcoming session will be a balanced day or an explosive trend day:
- Normal Day: The Initial Balance is wide and accounts for roughly 80-90% of the entire day’s range. Conviction from other timeframe participants is muted, and price simply rotates within the IB.
- Normal Variation Day: A moderate IB followed by an IB Extension (range expansion) during subsequent periods (C or D), typically extending the range by 1.5x to 2x the IB size before settling into balance.
- Trend Day: A very narrow Initial Balance immediately followed by persistent, directional range extensions. Price prints single-prints throughout the day, never re-entering the IB.
When tracking session opens, monitor when major global liquidity hubs open for business. Use our live Forex Market Hours Tracker to identify the London and New York session overlaps, where the vast majority of volume and Initial Balance expansions take place in currency and futures markets.
Virgin POC (VPOC) and Poor Highs / Lows
Beyond the current session’s boundaries, seasoned profile traders actively track structural anomalies from prior days:
- Virgin Point of Control (VPOC / Naked POC): A POC from a past trading day that price has never revisited. Because substantial commercial volume was transacted at that price, unvisited POCs act like powerful liquidity magnets. When price approaches a VPOC for the first time, it routinely produces sharp, high-probability responsive bounces.
- Poor Highs and Poor Lows: A daily auction extreme that terminates abruptly with two or more TPOs at the same tick rather than tapering into a tapered single-print tail. Poor extremes signify unfinished business where auction participants ran out of time rather than interest, suggesting the market will likely re-auction through that level in a future session.
| Concept | What it means in practice | How it feeds a decision |
|---|---|---|
| POC | The level with the most trading activity | Rotation target, balance reference, reaction level |
| VAH | Upper edge of the Value Area | Acceptance or rejection boundary to the upside |
| VAL | Lower edge of the Value Area | Acceptance or rejection boundary to the downside |
| Acceptance | Price holds outside the Value Area | Suggests a directional move may continue |
| Rejection | Price returns quickly inside the Value Area | Suggests a rotation back to balance |
| Asymmetric profile | Activity concentrated on one side | Sign of imbalance and preparation for a move |
The 80% Rule in Market Profile Trading
The 80% Rule is one of the most statistically reliable setups in Auction Market Theory, originally formulated by Peter Steidlmayer and popularized by Jim Dalton. It provides a structured roadmap for trading rotations across the entire Value Area when the market transitions from an out-of-balance state back into equilibrium.
The core premise is straightforward: when the market opens outside of the previous day’s Value Area, and then manages to trade back inside and gain acceptance, there is an 80% historical probability that price will rotate all the way across the Value Area to test the opposite boundary.

The 3-Step Execution Checklist for the 80% Rule
- Condition 1 (The Open): Price must open completely outside the previous session’s Value Area (either below the prior Value Area Low [VAL] or above the prior Value Area High [VAH]). This shows an initial market attempt to auction at an extreme.
- Condition 2 (Re-Entry): The market fails to find follow-through buying or selling outside the range, reversing back into the previous day’s Value Area.
- Condition 3 (Acceptance via Two 30-Minute Brackets): Re-entry alone is not sufficient. You must observe two consecutive 30-minute TPO prints (brackets) closing inside the prior Value Area. This two-bracket confirmation verifies genuine institutional acceptance rather than a momentary liquidity sweep or false breakout.
- Target (Take Profit): If price enters from below VAL, the primary profit target is the prior VAH. If price enters from above VAH, the primary target is the prior VAL. The Point of Control (POC) serves as an intermediate target where traders frequently scale out partial profits or move stops to breakeven.
- Invalidation & Stop Loss: Place the protective stop loss just beyond the low/high of the entry bracket or outside the Value Area edge. If price falls back out of value, the setup is invalidated.
When to avoid this setup: Do not blindly apply the 80% rule on days featuring high-impact macroeconomic data releases (such as FOMC rate decisions or Non-Farm Payrolls), or when the opening drive is fueled by institutional initiative volume accompanied by wide single-print buying or selling tails.
Hypothetical Example: Reading a Daily Profile
Suppose you are reviewing the daily profile of a currency pair and you read the following levels from your chart. These numbers are hypothetical and only illustrate the logic.
The daily POC sits at 1.0850, VAH at 1.0880 and VAL at 1.0820. Price is currently 1.0895, just above VAH. You have three scenarios:
- If price holds above VAH and a new profile builds between 1.0880 and 1.0900, acceptance is forming and you can consider a continuation setup.
- If price drops back below VAH and moves toward the POC at 1.0850, rejection is forming and the rotation-back-to-balance scenario gets stronger.
- If price chops between VAH and the POC, the market is undecided. Waiting for a clearer profile is a valid decision.
In all three cases, place the stop at a logical distance, for example below VAL or above VAH, and size the trade from that distance. Say you buy at 1.0895 with a stop at 1.0875, a 20-pip risk. If you risk $100 on the trade, the position size is $100 ÷ 20 pips = $5 per pip. The position size calculator confirms this in one step. If you trade this setup inside a prop challenge, check your allowed drawdown first with the prop firm drawdown calculator so you know how much room for error you have.
Common Mistakes
Mistake 1: Treating the POC as an automatic entry
Some traders enter every time price touches the POC. That is not what the level is for. The POC is a reference, not a signal. Check what happens at the level: whether a confirmation candle forms, volume rises, or the level overlaps with anything else.
Mistake 2: Ignoring the bigger context
A profile cannot be read in isolation from the broader trend. In a strong uptrend, acceptance above VAH is more likely than rejection. In a range, rejection at the edges is more likely. Check the larger trend before you act on any profile signal.
Mistake 3: Choosing the wrong period
If you trade with a swing horizon, a 5-minute profile will not help you. The profile period should match your trading horizon. Match the profile period to your trading horizon: a daily profile usually suits intraday trading, while a weekly or monthly profile suits swing trading.
Mistake 4: Skipping risk management
Even a correct read can be wrong. If your position size is off, a good analysis still turns into a large loss. Always define the stop and control risk per trade. To see how losing streaks play out, run your numbers through the trading strategy simulator, which models drawdown, losing streaks and prop challenge pass odds from a win rate and risk per trade.
Recommended Platforms & Brokers for Market Profile Traders
Trading TPO and Volume Profile requires accurate tick feeds, institutional liquidity, and zero-markup raw spreads.
TradingView
Best ChartingOffers built-in Fixed Range Volume Profile (FRVP) and Session Volume Profile tools for seamless macro and intraday value area mapping across Forex, Crypto, and Futures.
Explore TradingView Profile Tools →Vantage Markets
Raw ECN SpreadsDirect MT4/MT5 and TradingView integration, tier-1 bank liquidity feeds, zero-pip spreads on EURUSD/USDJPY, and lightning-fast trade execution for profile rotations.
Open Vantage Raw Account →Frequently Asked Questions
Does Market Profile work in every market?
The core logic rests on the distribution of price and time, so it applies to any market with enough liquidity. Data quality matters, though. In thin markets or pairs with wide spreads, the profile can be noisy. It is usually more reliable in futures and major forex pairs.
What is the difference between Volume Profile and Market Profile?
Volume Profile is built from traded volume at each price level. Classic Market Profile is built from time (TPO). Many platforms offer both, and traders pick based on need. In markets with reliable volume data, such as futures, Volume Profile is often the more precise choice.
Is the POC always a reversal level?
No. The POC is where the market found the most agreement, but that does not guarantee a reversal. In an imbalanced market, price can break the POC and move to a new level. Always read price behavior around the POC rather than trusting the level on its own.
How do I find the Value Area on my chart?
Many platforms include ready-made indicators. TradingView offers the Fixed Range Volume Profile tool, which lets you select a range and see the POC and Value Area edges. MetaTrader 5 supports custom indicators for the same purpose.
Is Market Profile suitable for beginners?
It is an analytical tool that needs practice. Beginners should start with support and resistance plus risk management, then add Market Profile as a second layer of analysis. Get position sizing and stop placement right first, then move to more advanced tools.
Further Reading
- CME Group — FX Market Profile User Guide
- CME Group — Education
- CME Group — Understanding the E-mini Nasdaq-100
- CFTC — Learn and Protect
Risk warning: Trading in financial markets, including forex and futures, involves the risk of losing capital. This article is for educational purposes only and is not investment advice or a trading signal. Check the rules of your broker or prop firm with official sources before making any decision, and only trade with capital you can afford to lose.