

Gold levels card
Oct 26, 2026
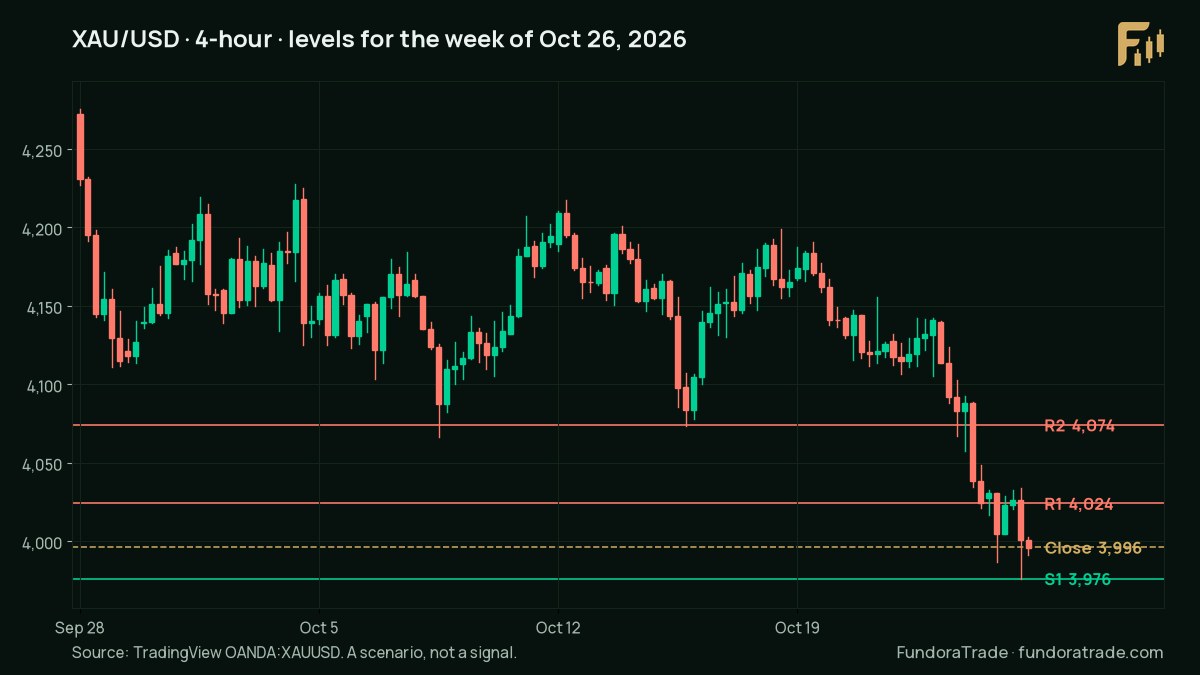
- Resistance 24,074+2.0%
- Resistance 14,024+0.7%
- Previous weekly close3,996
- Support 13,976-0.5%
Key events this week
- Tue Oct 27, 10:00 ET: CB Consumer Confidence
- Wed Oct 28, 14:00 ET: Federal Funds Rate
- Wed Oct 28, 14:00 ET: FOMC Statement
- Wed Oct 28, 14:30 ET: FOMC Press Conference
- Thu Oct 29, 08:30 ET: Advance GDP q/q
- Thu Oct 29, 08:30 ET: Core PCE Price Index m/m
A scenario, not a signal. Levels are watched zones, not exact prices.
Contents
Welcome to our weekly gold price outlook for the fourth week of October 2026. For our foundational technical analysis and historical track record, refer to our central Gold Price Forecast Next Week analysis hub.
Key points
- Bias for Oct 26–30, 2026: bearish. The weekly close of 3,996 sits below both the previous weekly close of 4,165 and last week’s VWAP of 4,095.
- Resistance 1 is 4,024 (bottom of last week’s value area). Resistance 2 is 4,074 (the low of the week before).
- Support 1 is 3,976 (last week’s low). A weekly close below it would keep the four-week range low of 3,976 in focus.
- The main event is the FOMC rate decision, statement and press conference on Wednesday, Oct 28 at 14:00 ET, with the forecast at 4.00% and the previous at 4.00%.
- Thursday brings Advance GDP, Core PCE and Unemployment Claims at 08:30 ET, a dense window for dollar and yield moves.
Gold last week
Spot gold (XAU/USD, TradingView) opened the week of Oct 19–23, 2026 at 4,168. It printed a high of 4,190 and a low of 3,976, then closed at 3,996. That is a loss of 169 dollars, or 4.1%, against the previous weekly close of 4,165.
The shape of the week matters more than the size of the drop. Price opened near the top of the range and closed near the bottom, within 20 dollars of the weekly low. The high of 4,190 failed to reach the prior week’s high of 4,217, and the close gave back the prior week’s gain. The four-week range now runs from 4,275 down to 3,976, and gold closed at the bottom of it.
Last week’s volume profile adds context. The point of control was 4,119, the value area ran from 4,024 to 4,156, and the weekly VWAP was 4,095. The close at 3,996 is below all three. In other words, the week’s accepted trading area sits above the market, and the close marks acceptance below value rather than a brief dip. That is the basis for the bearish bias this week.
What can move gold this week
First, a note on last week’s cross-asset backdrop. The US dollar index closed at 101.75, flat on the week. The US 10-year Treasury yield closed at 5.00%, down 8 basis points. Gold fell 4.1% anyway. A flat dollar and lower yields would normally be mild tailwinds for gold, so last week’s decline was not driven by those two inputs. That makes this week’s data and the Fed reaction more important than usual, because the metal has room to respond to both.
Wednesday, Oct 28, 14:00 ET: Federal Funds Rate, FOMC Statement, and 14:30 ET FOMC Press Conference (high impact). This is the week’s main event. The forecast is 4.00% and the previous is 4.00%, so the decision itself may be less important than the statement language and the press conference tone. A hawkish message, meaning emphasis on inflation risk or a slower path of easing, usually lifts the dollar and yields and tends to weigh on gold. A dovish message, meaning emphasis on growth risk or faster easing, usually softens the dollar and yields and tends to support gold. Given the 5.00% 10-year yield, the market is sensitive to any signal about how long rates stay high. Expect the widest moves of the week around 14:00 and 14:30 ET.
Thursday, Oct 29, 08:30 ET: Advance GDP q/q (high impact). Forecast 3.2%, previous 1.5%. This is the first estimate of third-quarter growth. A stronger reading than forecast usually supports the dollar and yields and is typically negative for gold. A weaker reading usually does the opposite. The size of the surprise matters, because the forecast already implies a sharp pickup from 1.5%.
Thursday, Oct 29, 08:30 ET: Core PCE Price Index m/m (high impact). Forecast 0.3%, previous 0.2%. This is the Fed’s preferred inflation gauge. A hotter print usually lifts rate expectations, the dollar and yields, and tends to pressure gold. A cooler print usually supports gold. Because it lands at the same time as GDP and claims, the first reaction may be noisy; the cleaner signal often comes in the second half-hour.
Tuesday, Oct 27, 10:00 ET: CB Consumer Confidence (medium impact). Forecast 80.5, previous 81.9. A stronger reading usually supports the dollar and is mildly negative for gold. A weaker reading usually does the reverse. Expect a smaller reaction than on Wednesday or Thursday.
Thursday, Oct 29, 08:30 ET: Advance GDP Price Index q/q (medium impact). Forecast 3.5%, previous 6.2%. This is a broad inflation read tied to GDP. A higher print usually supports yields and the dollar and weighs on gold; a lower print usually helps gold.
Thursday, Oct 29, 08:30 ET: Unemployment Claims (medium impact). Forecast 198K, previous 194K. Higher claims usually soften the dollar and support gold; lower claims usually do the opposite. The forecast is close to the previous, so a large surprise is needed for a meaningful move.
Friday, Oct 30, 08:30 ET: Employment Cost Index q/q (medium impact). Forecast 0.8%, previous 0.9%. This measures wage and benefit costs. A hotter print usually supports yields and the dollar and pressures gold; a cooler print usually supports gold. It is a modest input compared with Wednesday and Thursday.
Technical outlook and key levels
Gold closed at 3,996, below Resistance 1 at 4,024 and well below Resistance 2 at 4,074. It is also below last week’s VWAP of 4,095 and below the value area low of 4,024. That places the market outside and beneath last week’s accepted range, which is a bearish structural position. The nearest reference is Support 1 at 3,976, the weekly low. The four-week range low is the same 3,976, so this level carries extra weight: it is both last week’s low and the floor of the broader range.
| Level | Price (USD) | Why it matters |
|---|---|---|
| Resistance 2 | 4,074 | the low of the week before |
| Resistance 1 | 4,024 | bottom of last week's value area (VAL) |
| Last weekly close | 3,996 | reference point |
| Support 1 | 3,976 | last week's low |
The value area from 4,024 to 4,156 is now overhead supply. Any rally that stalls inside that band, especially near 4,074, would be a test of whether sellers remain in control. A close back above 4,024 would weaken the bearish case and suggest the breakdown below value was a false move. A close above 4,074 would challenge the bearish structure more directly, because that level is the prior week’s low and a break back above it would undo part of the recent damage.
On the downside, the market is trading in thin territory below value. The POC at 4,119 and the VWAP at 4,095 are far above price and act as magnets only if a recovery develops. For now, the path of least resistance runs toward 3,976. A weekly close below that level would confirm the breakdown and keep the four-week range low in play as the next reference. Until then, the level holds as support.
Scenarios for the week
Bearish scenario
This is the scenario in the direction of the bias. If gold stays below Resistance 1 at 4,024 and pressures Support 1 at 3,976, the bearish case remains active. A weekly close below 3,976 would confirm the breakdown and keep the four-week range low of 3,976 as the reference for further weakness. The scenario is canceled if gold closes back above Resistance 2 at 4,074, which would put price back above the prior week’s low and undermine the bearish structure.
Bullish scenario
If gold reclaims Resistance 1 at 4,024 and holds above it, the bearish breakdown starts to look like a false move. A weekly close above 4,024 would open Resistance 2 at 4,074 as the next target. A close above 4,074 would strengthen the recovery case and put the value area high of 4,156 in view. The scenario is canceled if gold closes back below Support 1 at 3,976, which would restore the bearish structure.
Economic calendar
The week is front-loaded with medium-impact data on Tuesday and then heavy on Wednesday and Thursday. The FOMC rate decision, statement and press conference on Wednesday at 14:00 and 14:30 ET are the highest-impact events. Thursday at 08:30 ET brings Advance GDP, Core PCE, the GDP Price Index and Unemployment Claims in a single window. Friday’s Employment Cost Index closes the week.
| Day | Time (New York) | Release | Impact | Forecast | Previous |
|---|---|---|---|---|---|
| Tue Oct 27 | 10:00 ET | CB Consumer Confidence | medium | 80.5 | 81.9 |
| Wed Oct 28 | 14:00 ET | Federal Funds Rate | high | 4.00% | 4.00% |
| Wed Oct 28 | 14:00 ET | FOMC Statement | high | — | — |
| Wed Oct 28 | 14:30 ET | FOMC Press Conference | high | — | — |
| Thu Oct 29 | 08:30 ET | Advance GDP q/q | high | 3.2% | 1.5% |
| Thu Oct 29 | 08:30 ET | Core PCE Price Index m/m | high | 0.3% | 0.2% |
| Thu Oct 29 | 08:30 ET | Advance GDP Price Index q/q | medium | 3.5% | 6.2% |
| Thu Oct 29 | 08:30 ET | Unemployment Claims | medium | 198K | 194K |
| Fri Oct 30 | 08:30 ET | Employment Cost Index q/q | medium | 0.8% | 0.9% |
Source: ForexFactory economic calendar; US dollar releases with high and medium impact.
Bottom line
Gold closed the week of Oct 19–23 at 3,996, below last week’s VWAP of 4,095, below the value area low of 4,024 and below the prior weekly close of 4,165. The bias for Oct 26–30 is bearish. Resistance 1 at 4,024 and Resistance 2 at 4,074 frame the upside; Support 1 at 3,976 is the line that matters on the downside. The FOMC on Wednesday and the Thursday data cluster are the main catalysts. Treat the scenarios above as conditions to watch, not as signals.
Stay aligned with institutional order flow and macro shifts through FundoraTrade’s continuous weekly gold market trend analysis.
Risk warning: Trading gold and other leveraged products carries a high level of risk and can result in the loss of all your capital. This outlook is educational analysis based on the stated data and does not constitute investment advice or a recommendation to buy or sell. Prices can gap and move quickly around data releases and central bank events. Past performance is not a reliable indicator of future results. Always manage risk and consider your own circumstances before trading.